GUI
<texit>\index{Visualize!Reference|(}</texit>
The Graphical User Interface for the software-radio is called Visualize, as it visualizes the internal structure and state of the modules. Furthermore it's possible to change configuration-parameters of the modules in real-time, while it is running.
This chapter is split into three sections: one for the general interface, one for the interaction windows, and one for the more internal structures.
General Interface
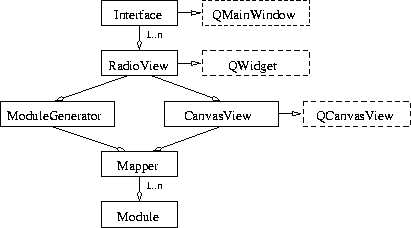
The main classes involved in displaying the main view are shown in figure <ref>fig:visualize_interface</ref>. Only the main subclassing from Qt is shown, subclassing from QObject and such is not shown.
 |
|
The classes involved in bringing up the main view
(visualize_interface.ps) |
<texit>\index{Visualize!Classes!Interface}</texit> There is one main-window, even if there are multiple radios to display. The main window, created by Interface, contains a QTabWidget with a tab for every active radio. If there is only one active radio, no tab will be shown.
<texit>\index{Visualize!Classes!RadioView}</texit> Each active radio that is show is served by a RadioView module which is the active QWidget for the corresponding tab. The RadioView updates the display once a second, and stops updating if it is not the active tab. While updating it checks for new or removed modules and asks each module to update the values shown in it's body.
<texit>\index{Visualize!Classes!ModuleGenerator}</texit> Each RadioView instance has it's own ModuleGenerator. On instantiation, the ModuleGenerator lists all available module and tries to determine which one is the main-module. In the most common situation, this will be a stfa, but it might be another module. The main-module is very important for the Mapper. For further updates, only added modules are taken into consideration.
<texit>\index{Visualize!Classes!CanvasView}</texit> All modules are drawn upon a CanvasView, which is subclassed from QCanvasView. CanvasView's main job is to create the context-menu when the user clicks the right mouse-button, as well as to move the canvas when the user drags it with the left mouse-button.
The Visualize!Classes!Mapper has a reference to all modules. He also figures out the position and connections of all modules, so that they fit nicely onto the CanvasView 1). The main-module is called stfa. As we only show one channel at a time, the Mapper needs also to know which is the current channel.
<texit>\index{Visualize!Classes!Module}</texit> Finally the Module represents the software-radio module with respect to all needed functionalities. It draws itself with the name and the chosen stats-parameters, including the pads for the connections; it can bring up windows for output- and stats-signals; it can ask the software-radio module to perform the signal-processing2).
Between all these modules a number of signals are passed in order to minimize the cross-module method calls.
Interaction
There are a number of ways the user can interact with the GUI:
- Chosing the stats to be displayed on the module
- Showing a stats-graphic
- Showing a graphic of an output-port
- Configuring values of a module
- Plotting stats-values
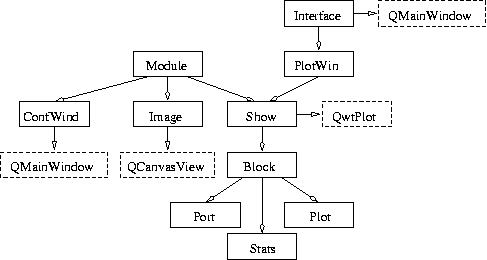
The active classes in doing this are shown in figure <ref>fig:visualize_display</ref>. The following list gives an overview of the used modules and their function, for a more detailed description, refer to the following subsections.
- Interface is the head of the visualize-tool and is the only one to have access to the menus
- Module represents a software-radio module
- Block is the virtual class for the (output)port, stats and plot
- Port knows how to read data from an output-port
- Stats reads a stats-'block' that represents some data
- Plot has a flexible data-part that can grow over time
- ConfWind shows a window with all configuration-options of the module
- Image is a special stats-'block' representing an image
- Show allows a Block to be displayed, complete with all control-widgets necessary
- PlotWin takes care of chosing the stats to be displayed
 |
|
The different display-options
(visualize_display.ps) |
Plotting
There are two possibilities of plotting: Y(t) and XY. The former takes only one stats-argument and displays it in time, while the latter displays one stats-argument as the function of a second one.
<texit>\index{Visualize!Classes!PlotWin}</texit> Once the user has chosen one of the two plotting-methods, the Interface class instantiates a PlotWin and sets up the signals so that the PlotWin will be informed whenever the user clicks on a module.
It is the software-radio that takes care of reading the stats-values and putting them into a list. The PlotWin class reads this list once a second and updates its internal values with the values read from the software-radio.
In a clean implementation, PlotWin would be a subclass of Show, but as PlotWin needs an initialised window to work with, this is not possible.
Configuration
<texit>\index{Visualize!Classes!ConfWind}</texit> If the user requests a reconfiguration of a module, a ConfWind class is instantiated and given the authority to change configuration parameters. The ConfWind acts independantly on changes from the user and transmits them to the software-radio.
Signal and Outputs
<texit>\index{Visualize!Classes!Show}</texit> Both require the Module to instantiate a Show, but give it either a Port or a Stats as argument. Show takes care of letting the user chose the method to display the signal (real, imaginary, complex, absolute, fft), zoom in and out, freezing and exporting to postscript and matlab.
Image
<texit>\index{Visualize!Classes!Image}</texit> Althogh Image is a stats-variable, it is implemented as a class on its own3). When the module is asked to show a stats, it decides whether it has to put an Image in a QMainWindow or a Show.
The Image-class takes care itself about updating and preparing the data for display.
Internal
These classes deserve some more specific treatement.
Mapper
<texit>\index{Visualize!Classes!Mapper}</texit> The mapper is described in a report of the students who wrote it. The report can be found in the software-radio tree under SRadio/Documentation/Report/Visualize.ps.bz2
Although the report is not up-to-date with most of the software-radio, the mapper has never been updated in the meantime. So everything described in the report with regard to the mapper is still accurate.
FifoCmd
<texit>\index{Visualize!Classes!FifoCmd}</texit> This is the link with the software-radio. The counterpart is in SRadio/Base/DBG/*. All possible requests and changes to the configuration are described by this class.
Module
<texit>\index{Visualize!Classes!Module}</texit> Together with the Mapper, this is one of the main classes. Its tasks consist of:
- Draw itself on the canvas with the name and the chosen stats-parameters, including the pads for the connections and eventual performance-measurements
- Show windows for output- and stats-signals, as well as configuration
- Process some data of the module. This is mostly useful in debugging-mode and for test-cases. It corresponds to a call_module in the software-radio.
<texit>\index{Visualize!Reference|)}</texit>